The NIPS experiment
This is a guest post by Eric Price.
I was at NIPS (one of the two main machine learning conferences) in Montreal last week, which has a really advanced format relative to the theory conferences. The double blind reviewing, rebuttal phase, and poster+lightning talk system all seem like improvements on the standard in my normal area (theoretical computer science), and having 2400 attendees is impressive and overwhelming. But the most amazing thing about the conference organization this year was the NIPS consistency experiment.
A perennial question for academics is how accurate the conference review and acceptance process is. Getting papers into top conferences is hugely important for our careers, yet we all have papers rejected that we think should have gotten in. One of my papers was rejected three times before getting into SODA – as the best student paper. After rejections, we console ourselves that the reviewing process is random; yet we take acceptances as confirmation that our papers are good. So just how random is the reviewing process? The NIPS organizers decided to find out.
The NIPS Experiment
The NIPS consistency experiment was an amazing, courageous move by the organizers this year to quantify the randomness in the review process. They split the program committee down the middle, effectively forming two independent program committees. Most submitted papers were assigned to a single side, but 10% of submissions (166) were reviewed by both halves of the committee. This let them observe how consistent the two committees were on which papers to accept. (For fairness, they ultimately accepted any paper that was accepted by either committee.)
The results were revealed this week: of the 166 papers, the two committees disagreed on the fates of 25.9% of them: 43. [Update: the original post said 42 here, but I misremembered.] But this “25%” number is misleading, and most people I’ve talked to have misunderstood it: it actually means that the two committees disagreed more than they agreed on which papers to accept. Let me explain.
The two committees were each tasked with a 22.5% acceptance rate. This would mean choosing about 37 or 38 of the 166 papers to accept1. Since they disagreed on 43 papers total, this means one committee accepted 21 papers that the other committee rejected and the other committee accepted 22 papers the first rejected, for 21 + 22 = 43 total papers with different outcomes. Since they accepted 37 or 38 papers, this means they disagreed on 21/37 or 22/38 ≈ 57% of the list of accepted papers.
In particular, about 57% of the papers accepted by the first committee were rejected by the second one and vice versa. In other words, most papers at NIPS would be rejected if one reran the conference review process (with a 95% confidence interval of 40-75%):
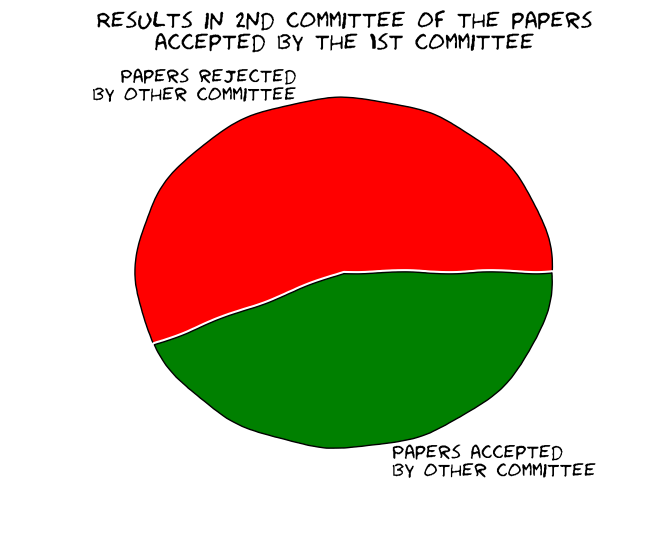
Most papers accepted by one committee were rejected by the other, and vice versa.
This result was surprisingly large to most people I’ve talked to; they generally expected something like 30% instead of 57%. Relative to what people expected, 57% is actually closer to a purely random committee, which would only disagree on 77.5% of the accepted papers on average:
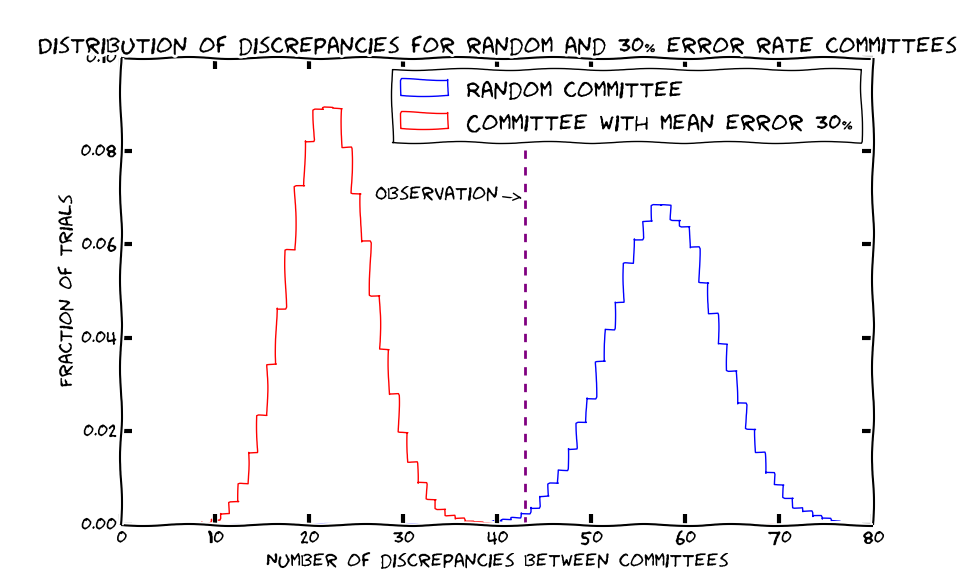
If the committees were purely random, at a 22.5%
acceptance rate
they would disagree on 77.5% of their acceptance lists on average.
In the next section, I’ll discuss a couple simple models for the conference review process that give the observed level of randomness.
Models for conference acceptance
One rough model for paper acceptance, consistent with the experiment, is as follows:
- Half the submissions are found to be poor and reliably rejected.
- The other half are accepted based on an unbiased coin flip.
This might be a decent rule of thumb, but it’s clearly missing something: some really good papers do have a chance of acceptance larger than one half.
The “messy middle” model
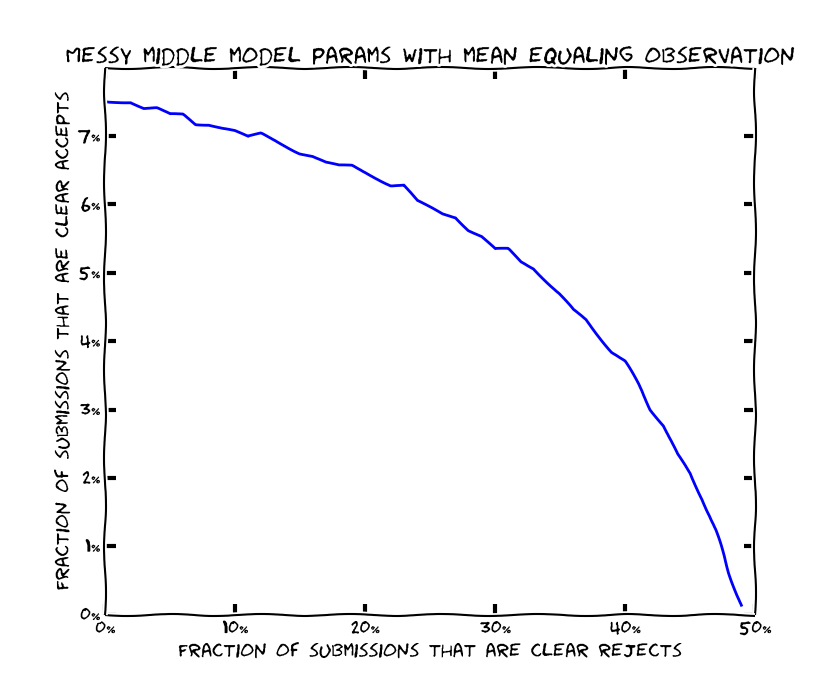
One simple extension to the above model is the “messy middle” model, where some papers are clear accepts; some papers are clear rejects; and the papers in the middle are largely random. We can compute what kinds of parameters are consistent with the NIPS experiment. Options include:
- The above model. Half the papers are clear rejects, and everything else is random.
- The opposite. 7% of all papers (i.e. 30% of accepted papers) are clear accepts, and the other 93% are random.
- Somewhere in the middle. For example 6% of all papers (i.e. 25% of accepted papers) are clear accepts, 25% of submitted papers are clear rejects, and the rest are random.
The “noisy scoring” model
As I was discussing this over dinner, Jacob Abernethy proposed a “noisy scoring” model based on his experience as an area chair. Each paper typically gets three reviews, each giving a score on 0-10. The committee uses the average score2 as the main signal for paper quality. As I understand it, the basic committee process was that almost everything above 6.5 was accepted, almost everything below 6 was rejected, and the committee mainly debated the papers in between.
A basic simplified model of this would be as follows. Each paper has a “true” score \(v\) drawn from some distribution (say, \({N(0, \sigma_{between}^2)}\)), and the the reviews for the paper are drawn from \(N(v, \sigma_{within}^2)\). Then the NIPS experiment’s result (number of papers in which the two committees disagree) is a function of the ratio \(\sigma_{between}/\sigma_{within}\). We find that the observation would be consistent with this model if \(\sigma_{within}\) is between one and four times \(\sigma_{between}\):
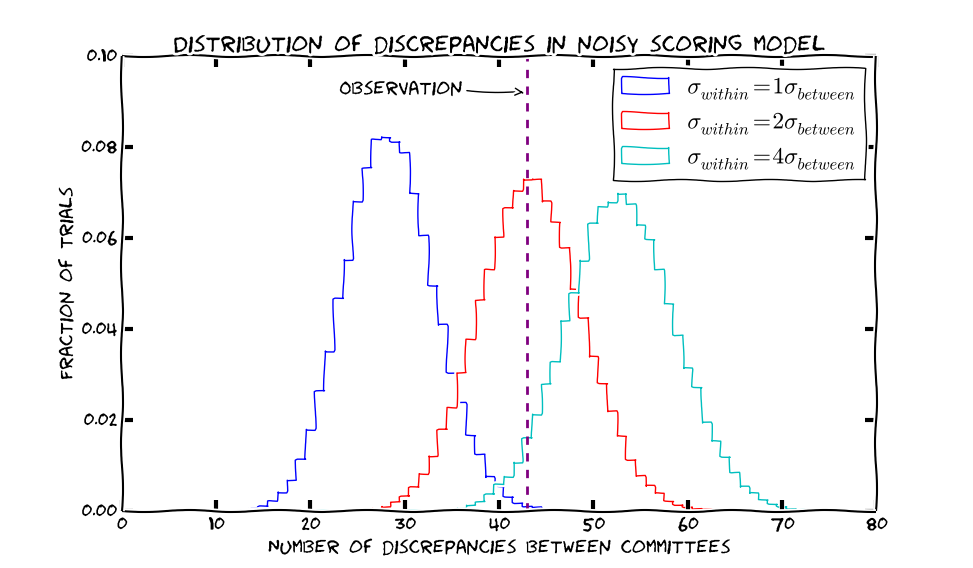
Once the NIPS review data is released, we can check the empirical \({\sigma_{within}}\) and \({\sigma_{between}}\) to see if this model is reasonable.
One nice thing about the noisy scoring model is that you don’t actually need to run the NIPS experiment to estimate the parameters. Every CS conference could measure the within-paper and between-paper variance in reviewer scores. This lets you measure the expected randomness in the results of the process, assuming the model holds.
Conclusions
Computer science conference acceptances seem to be more random than we had previously realized. This suggests that we should rethink the importance we give to them in terms of the job search, tenure process, etc.
I’ll close with a few final thoughts:
- Consistency is not the only goal. Double-blind reviewing probably decreases consistency by decreasing the bias towards established researchers, but this is a good thing and the TCS conferences should adopt the system.
- Experiments are good! As scientists, we ought to do more experiments on our processes. The grad school admissions process seems like a good target for this, for example.
- I’d like to give a huge shout-out to the NIPS organizers, Corinna Cortes and Neil Lawrence, for running this experiment. It wasn’t an easy task – not only did they review 10% more papers than necessary, they also had the overhead of finding and running two independent PCs. But the results are valuable for the whole computer science community.
Footnotes
- The committees did not know which of the ~900 papers they were reviewing were the 166 duplicated ones, so there can be some variation in how many papers to accept, but this is a minor effect.
- They also use a “confidence-weighted” score, but let’s ignore that detail.